Session 2: Probability, Odds and related things
20 June 2025
Introduction
- Commonly using statistics to infer things from data: known as statistical inference
- Built on probability theory
Terminology
Main things to be aware of are:
- Experiment / Trial / Event: The number of times something is conducted, e.g. a dice role or coin toss.
- Outcome: The possible result we are interested in. E.g. death, developing a disease
- Exposure: Groups that are systematically different who’s outcomes we might be interested in. E.g. treatment / control
Read to go?
Activity: Coin toss
In groups, or individually, toss a coin 20 times and note down how many ‘heads’ you get.
- What is the ‘experiment’?
- What is the ‘outcome’?
- How do you express your answer?
Probability
Probability is a way of quantifying events, and how likely they are to happen, out of the available options.
- a-priori: where we know the probability (like a dice role)
- empirical: where we have to work it out through observation
We usually describe this as the number of times an event is likely to occur, out of the number of possible events.
\[P(A) = \frac{\text{Number of outcomes making up event (A)}}{\text{Total number of outcomes}}\]
Example: coin toss
If we consider flipping a fair coin:
\[P(heads) = \frac{(1 * heads)}{(1* heads) + (1 * tails)} = \frac{1}{2} = 0.5\]
More examples: dice
If we consider a fair dice (die) roll, what is the probability of any given number, e.g. 6:
\[P(number) = \frac{(1 * number)}{\text{6 possible numbers}} = \frac{1}{6} = 0.16\dot{6}\]
More example: deck of cards (1)
If we consider a red card in a deck of cards (no jokers):
\[P(\text{red card}) = \frac{(26 * \text{red cards})}{(26 * \text{red cards}) + (26 * \text{black cards})} = \frac{26}{56} = \frac{1}{2} = 0.5\]
More example: deck of cards (2)
What would be the probability of drawing a queen in a full deck of cards (no jokers):
\[P(\text{queen}) = \frac{(4 * \text{queen})}{(52 * cards)} = \frac{4}{52} = \frac{1}{13} = 0.077\]
Activity: Dice rolling
Roll 2 dice at least 24 times and note them down. Write each possible number down: 1 - 12, and make a tally of each roll.
What do you see?
How would you calculate the probability of rolling each number?
What is the probability of rolling any given number on each die?
Types of relationships:
When we are considering more than one event, we have to assess the relationship between them.
Exclusivity: If one event prevents any other, we refer to it as exclusive ‘exclusive’. E.g. a coin toss being ‘heads’ mean it is not ‘tails’.
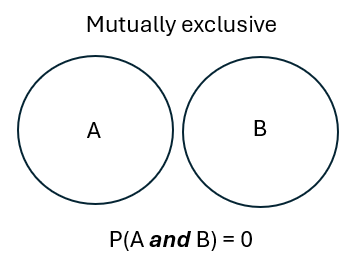
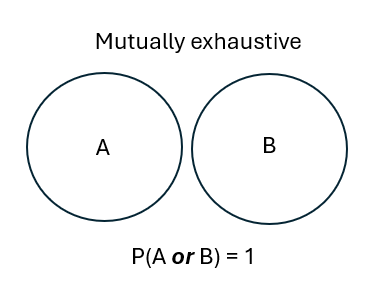
So the coin toss is mutually exclusive and exhaustive.
Exercises:
What are these two situations? Try and assess these in terms of exclusivity and exhaustivity:
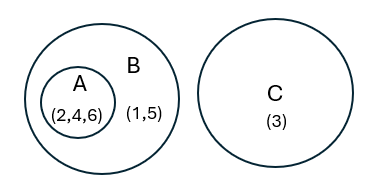
- Rolling a die and getting either an even number, or any number except 2.
- Rolling a die and getting either an even number, or any number except 3.
1. …even number, or any number except 2.
Exhaustive, not mutually exclusive
Rolling a 4 or a 6 are both even, but the set contains all results.
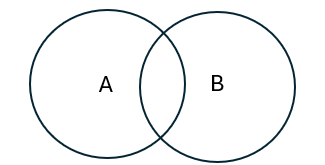
2. … even number, or any number except 3.
It’s complicated
Considering A & B, it’s not exhaustive nor exclusive.
Interlude:
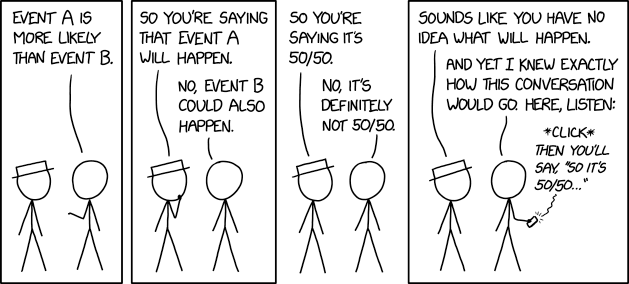
Source: XKCD: A webcomic of romance, sarcasm, math, and language. https://xkcd.com/2370
Independence / Conditionality
When we are considering more than one event, we have to assess whether or not they are related.
- If two events do not have effects on each other, then they can be considered to be independent.
- If one event has an effect on the subsequent outcomes, then they are considered condition.
Let’s apply it
Example (1)
You have a bag of “M&Ms”, containing two blue and 5 red M&Ms.
What’s the probability of drawing two consecutive red M&Ms?
Draw 1 = \(P(red) = \frac{5 * red}{(5 * red) + (2 * blue)} = \frac{5}{7} = 0.71\)
You drew a red.
Draw 2 = \(P(red) = \frac{4 * red}{(4 * red) + (2 * blue)} = \frac{4}{6} = 0.6\dot{6}\)
Example (2)
You have a bag of “M&Ms”, containing two blue and 5 red M&Ms.
What’s the probability of drawing two consecutive red M&Ms?
What would happen if you replaced the red M&M in the bag before the second draw?
How would you describe this situation now?
Conditional Probability
We can use | in our notation to show conditional probability: \(P(B|A)\)
So the probability of B, given that A has happened.
This leads us to the probability of A and B:
\[P(\text{A and B}) = P(A) * P(B|A)\]
The M&M example:
Applied to our M&Ms, the probability of drawing two consecutive reds:
- First draw has a denominator of 7
- By removing 1 M&M, the second draw must have a denominator of 6
\[P(\text{Draw 2 | Draw 1}) = P(\text{Draw 1}) * P(\text{Draw 2 | Draw 1})) = \frac{5}{7} * \frac{4}{6} = 0.48\]
Activity
Calculate the probability of rolling two 3’s with a fair, six-sided die
Calculate the (a-priori) probability of rolling a total of 8 with two rolls of a fair, six-sided die
Hint: You will need to draw this out and count
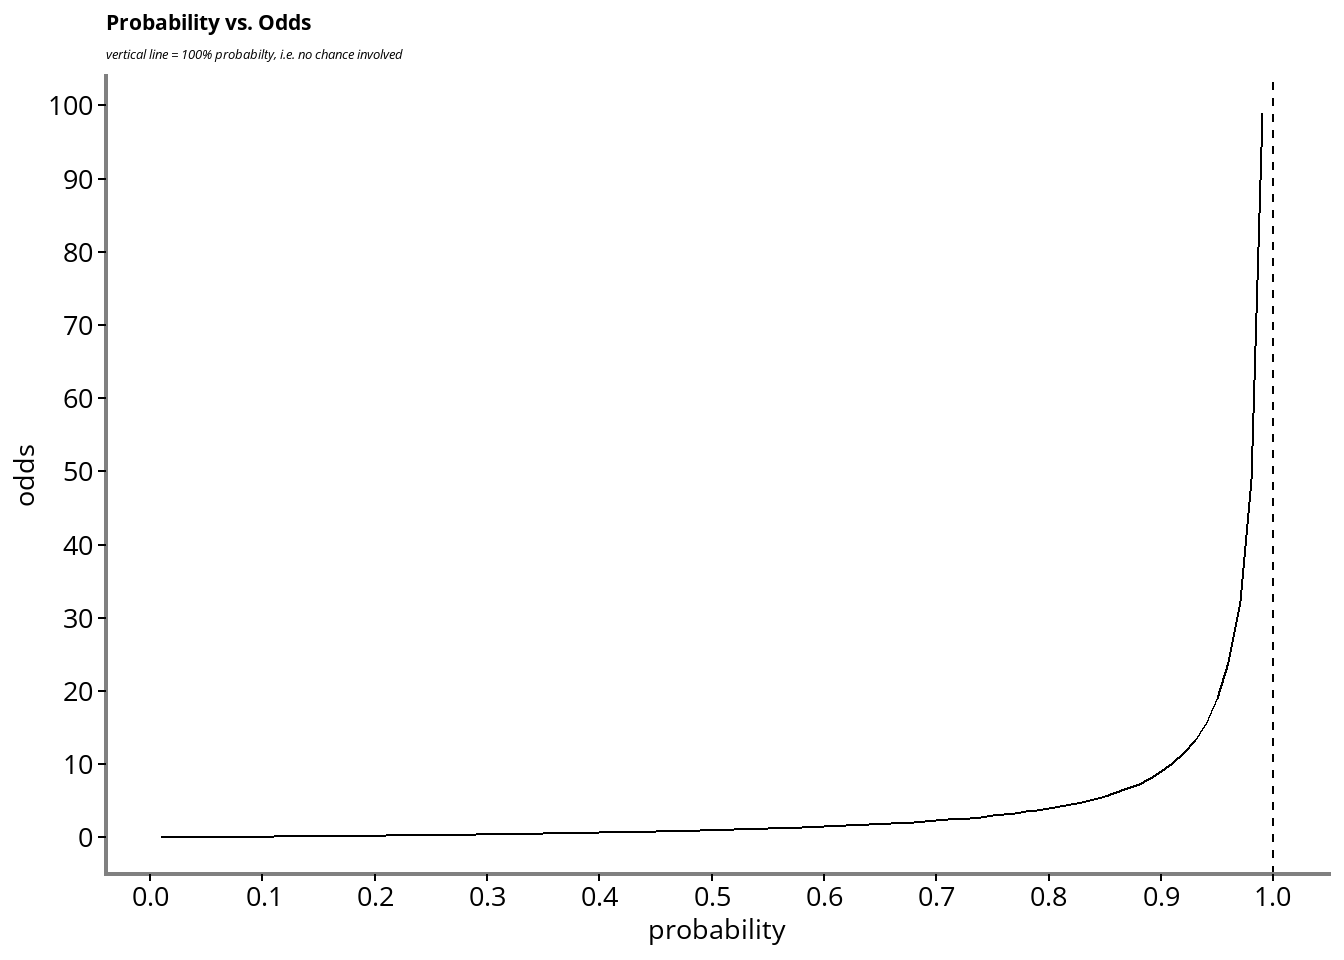
Odds
We have looked at probability, but ‘odds’ is related:
We keep the same numerator
Denominator is 1-numerator
Mutually exclusive and exhaustive
\[Odds(A) = \frac{P(A)}{1 - P(A)}\]
Example: Odd in the coin toss
\[Odds(Heads) = \frac{P(Heads)}{1 - P(Heads)} = \frac{0.5}{(1-0.5)} = 1 \] … or if you are used to sports betting, we might hear the odds described as 1:1.
Are Odds and Probability the same?
Next:
Using all this stuff in analytics
- Used often in PHM and epidemiology / public health
- Basis for lots of our statistical measure
The “2 x 2 table”
| O(+) | O(-) | |
|---|---|---|
| E+ | a | b |
| E- | c | d |
- E = ‘Exposure’, meaning how the groups differ
- O = Outcome, what were the different results in groups
Using the 2x2 table
We often use the 2 x 2 table in epidemiology to express the probability of events. We can use different sums from the table to express different elements of the data.
| O(+) | O(-) | |
|---|---|---|
| E+ | a | b |
| E- | c | d |
| O(+) | O(-) | |
|---|---|---|
| E+ | 50 | 62 |
| E- | 550 | 760 |
Prevelence of the outcome
Prevalence: the people in the population with the condition at any given time.
Incidence: the number of new cases in a time period.
Both measure relate to a specific time periods, but in different ways.
We can calculate the prevalence from the 2 x 2 table.
\[Prevalence_{o+} = \frac{(a + c)}{(a + b + c + d)} = \frac{(50 + 550)}{(50 + 62 + 550 + 760)} = 2022\]
Absolute risk
When we use ‘absolute’ it refers to real numbers, not relative difference.
- Risk of outcome in the exposed group: \(R_{E+} = a / (a+b) = 50 / (50 + 62) = 0.45\)
- Risk of outcome in the un-exposed group: \(R_{E-} = c / (c+d) = 550 / (550 + 760) = 0.42\)
Risk difference
Using the two absolute risk measures, we can calculate the difference:
\(\text{Risk Difference} = R_{E+} - R_{E-} = 0.45 - 0.42 = 0.03\)
Interpretation: “3% of the outcomes could be attributed to the exposure, the rest would have happened anyway”
Number Needed to Treat (NNT)
This transforms a difference in risk in to real numbers of people.
Measure of how many more people we would need the exposure/treatment for one to benefit.
\[NNT = 1 / (RD) = 1 / 0.03 = 33.\dot{3}\]
We would need to expose / treat 33 patients for one to benefit.
Relative risk
This is the ratio of risk in two different (exposure) groups. We may want to compare the risk in each exposure group and get a measure of that relationship.
\[ RR_{(E+ / E-)} = \frac{a / (a + b)}{c/ (c + d)}\]
- RR < 1, event is less likely in the exposure group
- RR = 1, event is equally likely in the exposure group
- RR > 1, event is more likely in the exposure group
Interlude
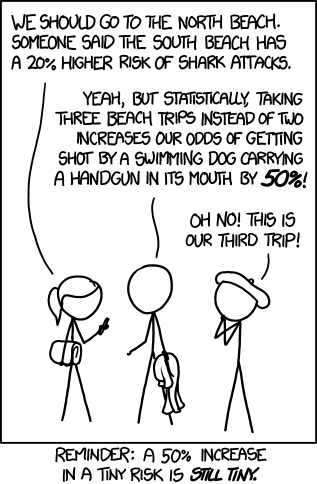
Source: XKCD: A webcomic of romance, sarcasm, math, and language. https://xkcd.com/1215
Odds ratios
- Odds in exposed group: \(a / b\)
- Odds in exposed group: \(c / d\)
Therefore, the odds ratio: \[ \text{OR(Exposure+ / Exposure-)} = \frac{a / b}{c/ d}\] The interpretation of an OR is the same as that of an RR, with the word odds substituted for risk.
Exercise:
| O(+) | O(-) | |
|---|---|---|
| E+ | a | b |
| E- | c | d |
| O(+) | O(-) | |
|---|---|---|
| E+ | 20 | 42 |
| E- | 248 | 3445 |
Calculate:
- Risk in each exposure group
- Relative Risk
- NNT
- Odds ratio (if you have time)
Answers (1):
| O(+) | O(-) | |
|---|---|---|
| E+ | a | b |
| E- | c | d |
| O(+) | O(-) | |
|---|---|---|
| E+ | 20 | 42 |
| E- | 248 | 3445 |
1. Risk in the exposure group: \(R_{E+} = a / (a+b) = 20 / (20 + 42) = 0.32\)
- Risk in the un-exposed group: \(R_{E-} c / (c+d) = 248 / (248 + 3445) = 0.07\)
Answers (2):
- Relative risk \(RR_{(R_{E+} / R_{E-})} = 0.32 / 0.07 = 4.57\)
- NNT: \(NNT = 1 / (0.32 - 0.07) = 4\)
- Odds ratio: \[ \text{OR(E+ / E-)} = \frac{a / b}{c/ d} = (20/42)/(248/3445) = 6.61\]
Fin
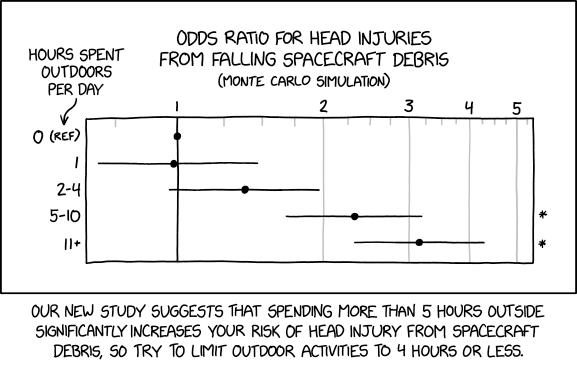
Source: XKCD: A webcomic of romance, sarcasm, math, and language. https://xkcd.com/2599
![]()